

Investment Strategy
The Racial Wealth Gap
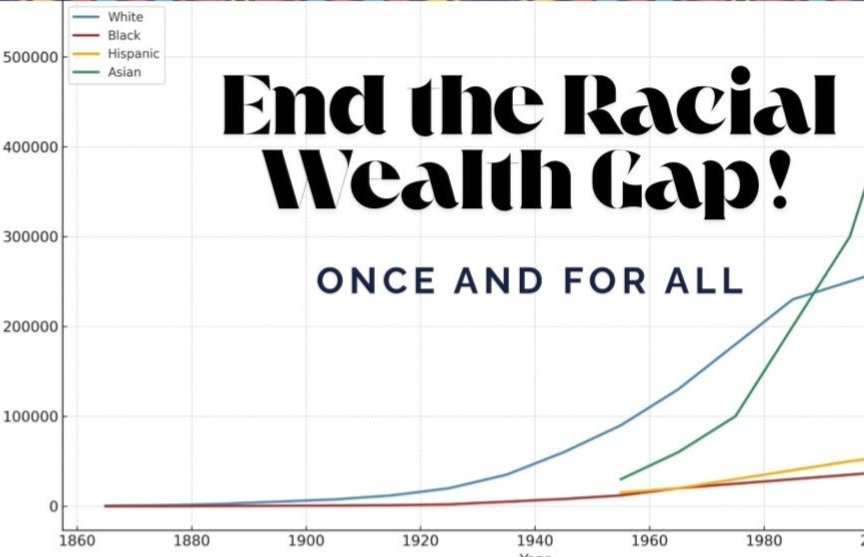
Chart 1: This chart illustrates the stark disparity in median family wealth across racial groups from 1860 to the present. It shows how White families have consistently accumulated significantly more wealth than Black, Hispanic, and Asian families, with the gap widening dramatically over time despite progress in civil rights.
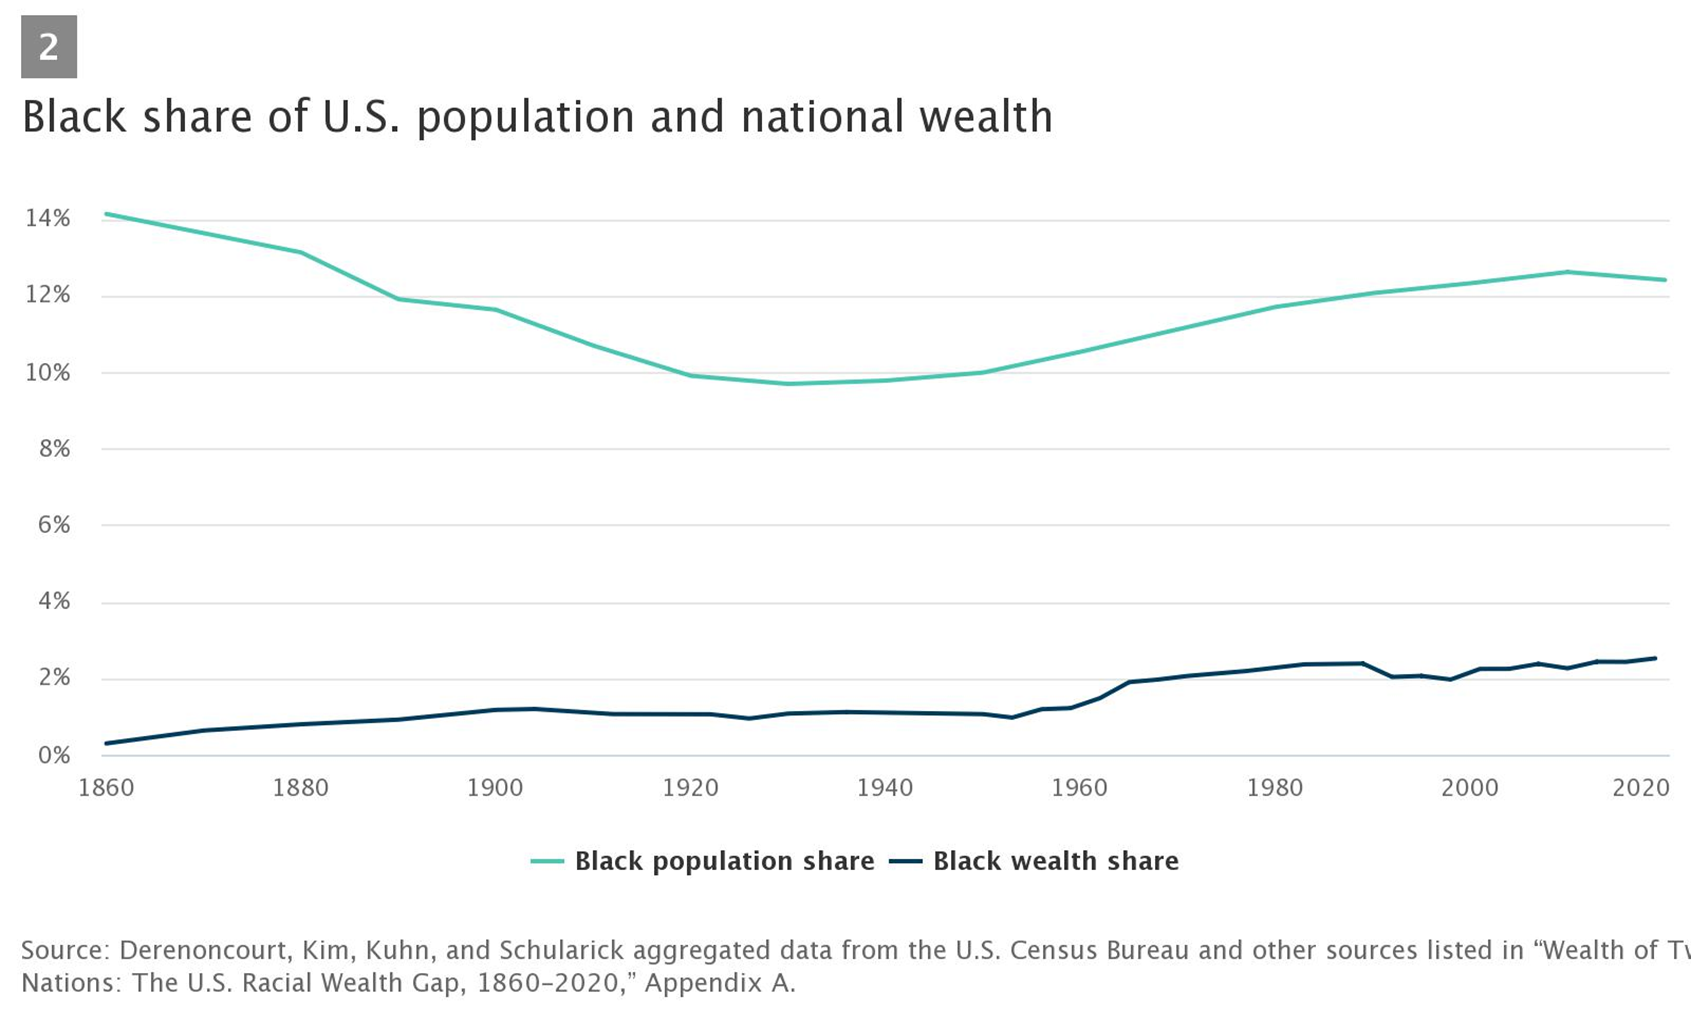
Chart 2: This chart compares Black Americans’ share of the U.S. population (consistently around 12-14%) against their share of national wealth (only 1-3%). This persistent gap demonstrates how systemic barriers have prevented proportional wealth accumulation despite equal population representation.
14 Generations of Black People in the USA
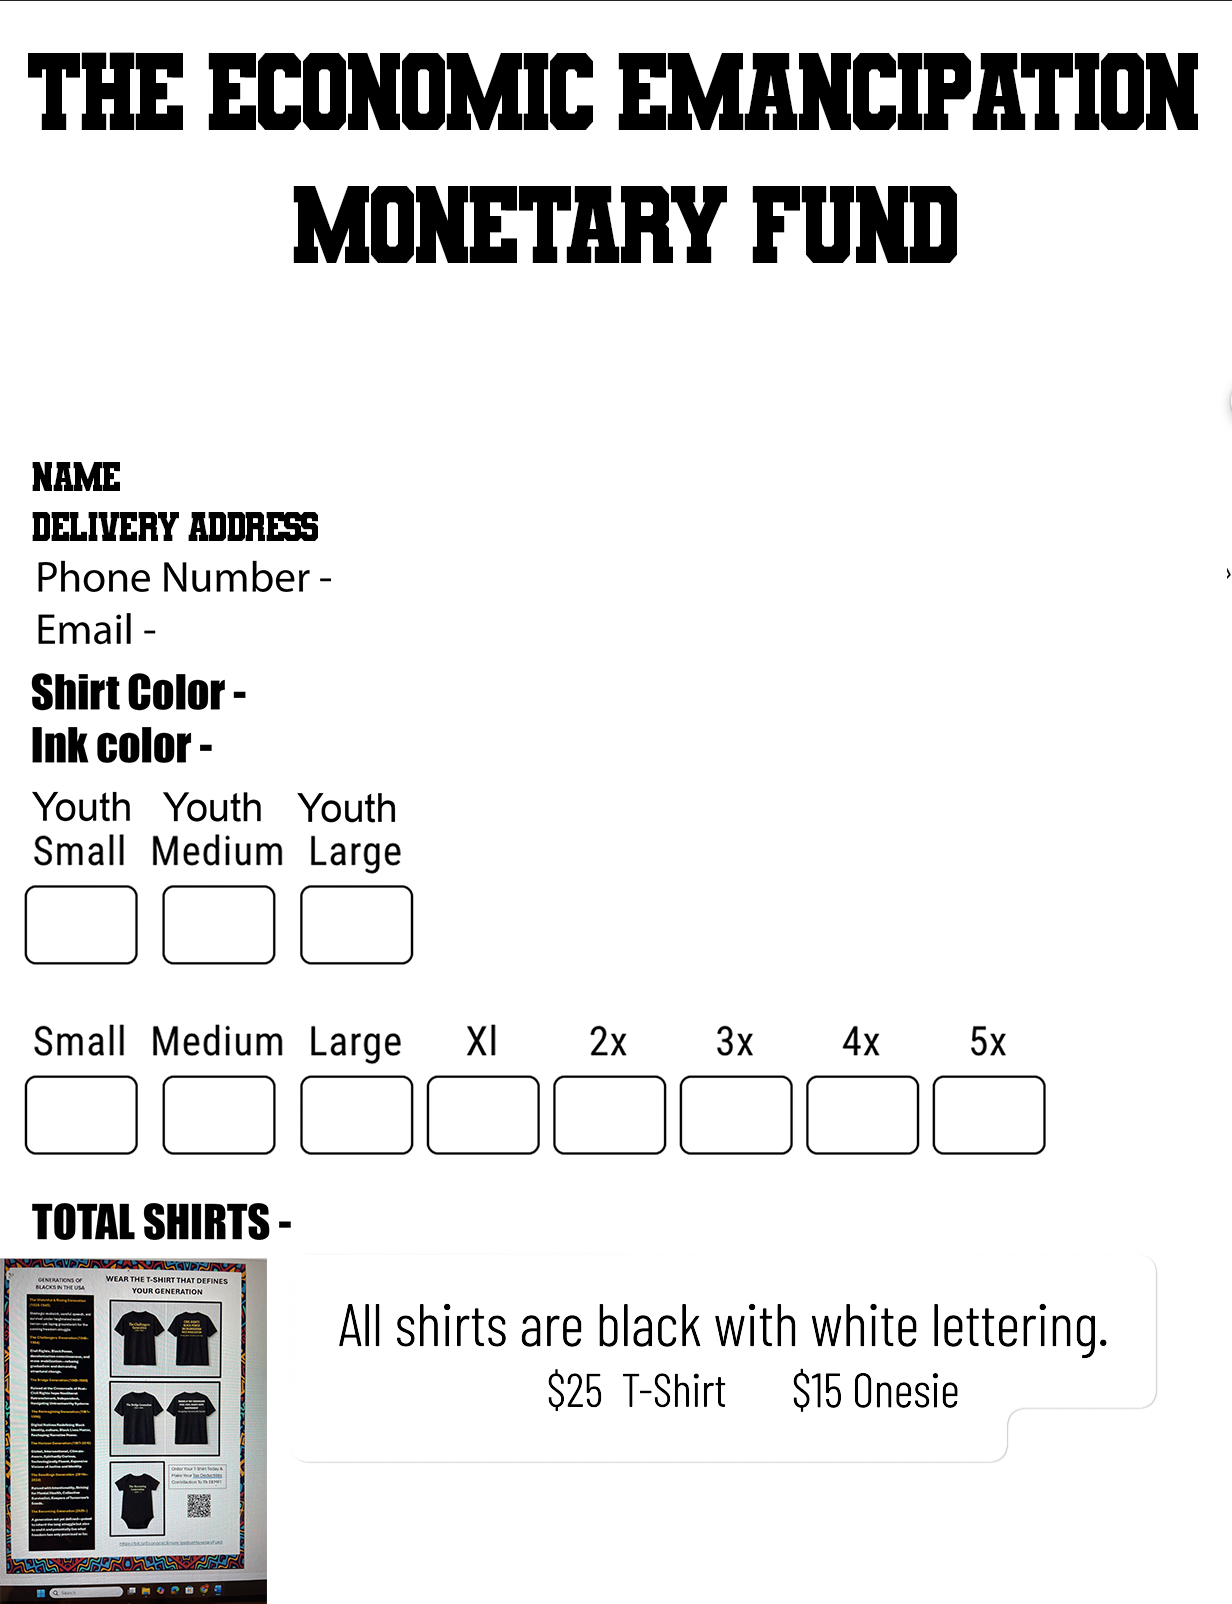
Want a T-Shirt to Rep Your Generation?
Download and fill out the form, send via email to eemf1amonth@gmail.com. Your purchase is a contribution to the Building Infrastructure Fund and is tax deductible.